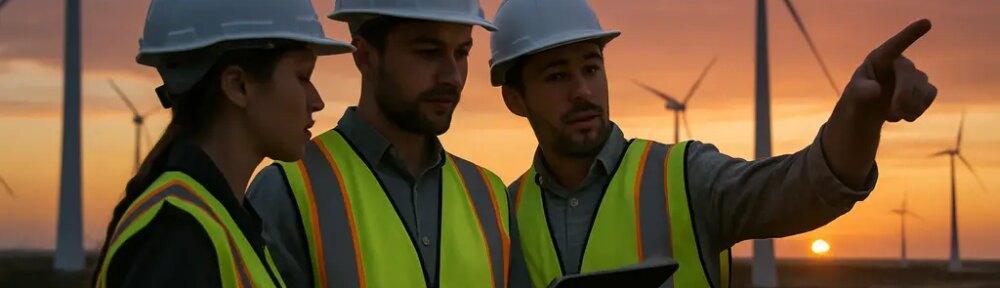
As of September 14, 2026, clean energy additions planned for the year point to a record-setting period for U.S. power-sector construction, led by solar and battery storage. The data should be read with care: planned capacity is not the same as completed capacity, and the power-system effect depends on interconnection, permitting, market conditions, and how reliably new resources operate once connected.
The near-term signal is still significant. The U.S. Energy Information Administration reports that developers plan to add 86 gigawatts of new utility-scale electric generating capacity in 2026, which would be a record if realized. EIA identifies solar as the largest planned share at about 43.4 GW, followed by about 24 GW of battery storage and 11.8 GW of wind, according to EIA capacity data.
Those figures do not prove that the power sector has solved reliability, affordability, or siting constraints. They do show that the center of new capacity planning has shifted toward resources with different operating patterns than coal, gas, hydro, or nuclear plants. For students and workers considering green career paths, that shift matters because the bottlenecks are no longer limited to equipment manufacturing or project finance. They also include grid engineering, commissioning, storage operation, data analysis, safety, and maintenance.
Why Clean Energy Additions Matter In 2026
Clean Energy Additions And The U.S. Mix
The scale of clean energy additions in the United States is notable because the planned 86 GW total would exceed the 53 GW of new capacity added in 2025, which EIA describes as the highest annual addition since 2002. Solar alone is expected to be roughly 60% higher in 2026 than in 2025. That does not mean every region will experience the same change. Utility-scale additions depend on project queues, transmission access, financing, equipment delivery, labor availability, and state-level market rules.
The planned mix also shows why capacity and generation should not be treated as identical measurements. A gigawatt of solar capacity does not produce electricity at the same times or with the same capacity factor as a gigawatt of nuclear, gas, wind, or hydro capacity. Solar additions can reduce daytime fossil generation where they are connected to suitable grids, but their value changes with local demand patterns, weather, curtailment risk, and the availability of flexible resources.
Global Deployment Has Become More Solar-Heavy
The global pattern is similar, though not uniform. The International Energy Agency reported that renewable capacity additions reached nearly 800 GW in 2025, up 16% from the prior year. Solar PV accounted for more than 75% of that growth, while wind contributed around 20%, with hydropower, bioenergy, geothermal, and marine energy making up the remaining share, according to the IEA’s solar PV and wind analysis.
China accounted for more than 60% of global renewable capacity growth in 2025, commissioning nearly 370 GW of solar PV and 117 GW of wind. India also increased annual renewable additions by roughly 60% in 2025, driven mainly by almost 50 GW of solar PV. The European Union added nearly 85 GW of new renewable capacity in 2025, led by about 70 GW of solar PV, while sub-Saharan Africa and the Middle East and North Africa each reached around 12 GW. These numbers show broad momentum, but they also show that deployment remains highly uneven by region.
Storage And Grid Readiness Set The Constraint
Battery Growth Changes The Integration Task
These clean energy additions are not interchangeable with older central-station capacity. Solar and wind output vary with resource conditions, so the system value of new renewable capacity rises when paired with storage, demand flexibility, transmission, and operating practices that can manage variability. In the United States, planned utility-scale battery additions of about 24 GW in 2026 represent a major increase from the 15 GW added in 2025. EIA expects Texas, California, and Arizona to receive about 80% of that new storage capacity.
That regional concentration is useful where solar output is high and evening demand creates a need for stored electricity. It is also a reminder that storage build-out is not yet evenly distributed. A battery installed in one market cannot solve congestion or flexibility shortages in another market unless transmission, market dispatch rules, and operating needs align. Storage is a commercial technology, but its grid value depends on duration, charge-discharge cycles, siting, interconnection, safety practices, and market compensation.
Permitting And Flexibility Remain Measurable Risks
Record planned capacity can still underperform if grids cannot absorb the output. The research points to permitting, market reform, grid flexibility, storage, and related infrastructure as areas that need to scale alongside generation. Those are not abstract concerns. A solar project delayed by interconnection studies, a wind project slowed by permitting, or a battery project waiting for grid upgrades does not contribute to reliability until it is operating.
There is also a measurement issue. Capacity announcements can create a sense of certainty before projects are complete. Analysts should separate nameplate capacity, commissioned capacity, annual generation, capacity credit, and emissions outcomes. A project can be counted as planned, placed in a queue, physically built, commercially operating, or producing at expected output. Each stage gives a different view of progress.
For readers interested in cross-disciplinary insights, exploring research on the Harvard Science Review emphasizes the importance of grounding claims in precise measurement and defined constraints.
Geography Shows Uneven But Broadening Momentum
China And India Set Much Of The Pace
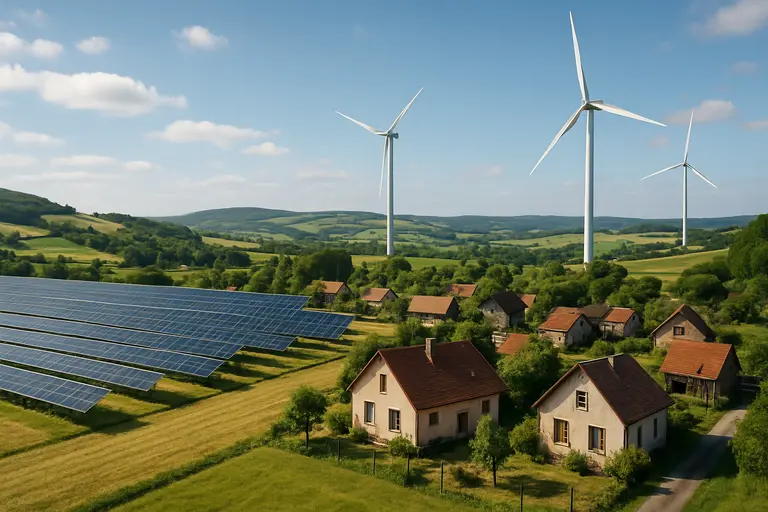
China’s 2025 deployment numbers place it at the center of renewable capacity growth. The reported commissioning of nearly 370 GW of solar PV and 117 GW of wind in one year gives China a scale advantage in project delivery, grid planning, manufacturing coordination, and operating experience. That does not mean other regions can copy the same deployment model. Land availability, grid ownership, financing terms, local demand growth, industrial policy, and permitting structures differ widely.
India’s increase is also important because it pairs high electricity-demand growth with rising renewable deployment. Nearly 50 GW of solar PV additions in 2025 point to a larger role for solar in meeting future demand, while doubled wind additions remained smaller in absolute terms. The evidence supports a cautious interpretation: solar is the dominant growth technology, but balanced systems still require transmission, storage, flexible generation, demand response, and operations staff who can manage higher shares of variable output.
Regional Growth Raises Workforce Questions
In the European Union, sub-Saharan Africa, and the Middle East and North Africa, 2025 additions show that growth is not confined to one market. The EU’s nearly 85 GW of renewable additions, led by solar PV, reflects a mature policy and grid setting with its own constraints. The roughly 12 GW additions reported for both sub-Saharan Africa and MENA show acceleration from smaller bases, where financing, grid access, and project execution can be decisive.
For workforce planning, the geographic spread matters because the skills needed are both local and technical. Project developers need permitting and community engagement capacity. Grid operators need forecasting and dispatch expertise. Contractors need electricians, civil crews, and safety-trained workers. Asset owners need technicians who can maintain inverters, trackers, turbines, substations, and battery systems under real operating conditions.
Clean Energy Additions And Green Career Signals
Skills Follow The Bottlenecks
Clean Energy Additions at record scale create career signals, but they should not be read as a simple hiring guarantee. Capacity targets and planned projects can change. Delays can move work from one year to another. Regional differences can shift demand for installers, engineers, analysts, and technicians. A careful career strategy should track where projects are actually being built, which technologies are receiving interconnection approval, and which firms are operating assets rather than only announcing them.
The practical skills with the clearest connection to the 2026 data are tied to project execution and grid integration:
- Solar PV design, commissioning, inverter troubleshooting, and performance monitoring.
- Battery storage safety, controls, dispatch analysis, and degradation tracking.
- Transmission planning, interconnection studies, and grid modeling.
- Wind operations, maintenance planning, and site-performance analysis.
- Energy data analysis that distinguishes capacity, generation, curtailment, and emissions effects.
People considering renewable energy work should also treat storage and grid roles as part of the clean-power sector, not as separate support functions. A record solar build-out without enough flexibility can produce curtailment, congestion, and weaker project economics. A better-trained grid and storage workforce can help convert planned capacity into usable electricity.
Cautious Signals For Career Planning
The career message is positive, but it is not unlimited. Solar PV is the dominant source of recent renewable capacity growth, battery storage is expanding quickly in key U.S. markets, and wind remains a meaningful part of additions. Yet not every clean-energy occupation will grow at the same rate, and not every region will offer the same opportunities. Workers should compare national capacity data with local project pipelines, state policy, utility procurement, and employer demand.
For a related evidence-led career discussion, SGTT’s review of renewable energy jobs is a useful companion to capacity planning data. The key point for 2026 is that capacity growth changes the work that must be done across the power system. The strongest career paths will likely sit where deployment pressure meets measurable constraints: interconnection, construction quality, storage operation, grid flexibility, and long-term asset performance.
The 2026 record, if realized, would mark a significant build-out year. Its lasting value will be measured less by headline gigawatts than by delivered generation, reliable operation, cost control, and the ability of trained workers to keep new assets performing safely over time.