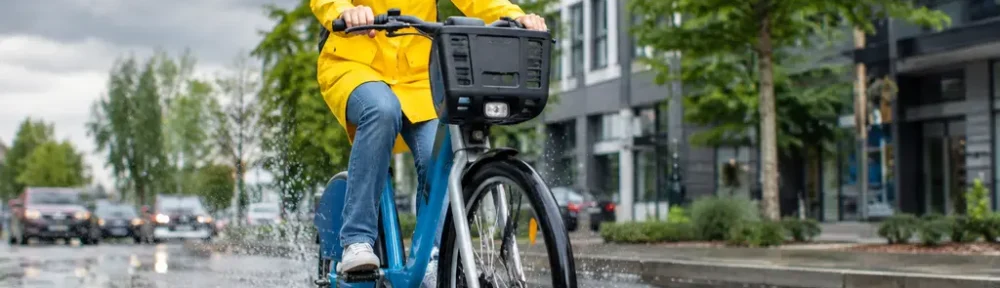
Bike-Sharing Ridership is one of the more sensitive signals in urban transportation because it reacts quickly to conditions that riders feel at street level: heat, cold, rain, wind, visibility, and smoke. For cities trying to reduce car dependence, those reactions matter. A docked bike system may look like simple green infrastructure, but its daily use depends on a chain of operational choices, rider risk perception, and the condition of the public right of way.
The recent U.S. evidence is clearer on weather than on ordinary air pollution. Temperature and precipitation show consistent associations with use, while air quality effects appear weaker unless pollution becomes visible, acute, or physically difficult to ignore. That distinction is useful for transportation agencies, bike-share operators, and city departments that coordinate curb space, waste collection, street sweeping, and transit access on the same street network.
What The Evidence Says About Bike-Sharing Ridership
Bike-Sharing Ridership And Weather Thresholds
A 2026 study of five major U.S. cities covering 2020 through 2024 found that ridership peaked when daily temperature fell in the 20–25 °C range, while precipitation consistently reduced use. The same study reported that weather variables had stronger effects than air quality metrics, except during highly visible or dangerous smoke conditions, according to the 2026 five-city study. That pattern fits a practical interpretation: riders respond most strongly to conditions that immediately change comfort, safety, and travel reliability.
For Bike-Sharing Ridership, the temperature finding is not a claim that every city has the same ideal cycling day. Local baseline climate, station density, terrain, bike-lane quality, and trip purpose can all shape response. Still, the 20–25 °C range gives planners a useful benchmark for comparing seasonal demand and understanding why some systems see sharp swings across the year.
Rain As A Consistent Deterrent
Precipitation is easier to interpret than many air quality variables because it directly affects visibility, braking, clothing, road surface conditions, and rider comfort. The research notes do not provide a universal percentage drop for rain across all U.S. systems, so the safest statement is qualitative: precipitation consistently reduced usage in the five-city analysis. Cities should avoid treating rainy-day declines as evidence of weak demand for cycling. They may instead indicate that the network lacks weather-protected alternatives, safe drainage near bike lanes, or reliable connections to transit.
Weather, Smoke, And Trip Purpose
Wildfire Smoke Produces Larger Drops When It Is Acute
Air pollution does not affect ridership in a single uniform way. In the five-city study, routine pollutants such as ozone showed weaker negative effects and sometimes positive associations, likely because they can coincide with sunny, warmer days. That does not mean pollution is beneficial. It means simple correlations can be misleading when weather and air quality move together.
Wildfire smoke is different. A large analysis across 12 U.S. cities from 2010 through 2024, covering 371 million bike-share trips, estimated that increasing wildfire-derived PM₂.₅ from 0 µg/m³ to 25 µg/m³ was associated with an average 8.2% decline in daily rides. At 50 µg/m³, the estimated decline was about 20.8%, based on the 12-city smoke analysis. The same research reported peak daily bike-share ridership declines of 25% to 82% during major smoke events, including smoke transported from Canadian wildfires into the Northeastern U.S. in 2023.
Commuting And Recreation Do Not React The Same Way
The smoke analysis also found that weekend bike-share trips were about five times more responsive to increases in smoke or PM₂.₅ than weekday trips. That result is consistent with a common transportation pattern: discretionary rides are easier to cancel than commute or errand trips. It should not be read as proof that weekday riders are unaffected by smoke. A lower response may mean they had fewer substitutes, not that conditions were safe or comfortable.
This distinction matters for equity. If some riders continue using bikes during poor conditions because they lack a practical alternative, a ridership total alone can hide exposure and burden. A cautious planning approach would compare weather and air quality effects by neighborhood, trip purpose, access to transit, and availability of protected routes, while acknowledging that the research summarized here does not provide all of those cross-tabs.
Planning Limits For Operators
Station Balancing Cannot Solve Weather Exposure Alone
Bike-share operators can rebalance bikes, maintain docks, adjust staffing, and prepare for high-demand days. Those actions help system reliability, but they do not remove the physical barriers created by rain, poor visibility, heat, or smoke. A forecast-informed operations plan may reduce empty docks or full stations during favorable weather, yet it cannot make a rider choose a bike during hazardous air or heavy precipitation.
For cities, the stronger lever is infrastructure. Shaded corridors, safer intersections, drainage maintenance, and connections to transit can make more trips possible during marginal conditions. A related SGTT analysis of Chicago bike-share heat patterns examined how greenery near stations can shape heat exposure discussions. That type of local evidence is valuable because weather sensitivity is not only a rider preference issue; it is partly a street design issue.
Cost And Scale Require Prioritization
Most cities cannot upgrade every corridor at once. The evidence suggests a practical ranking method: identify stations with high baseline use, high weather sensitivity, limited transit alternatives, and repeated exposure to heat, precipitation, or smoke disruption. Those locations may produce more measurable benefits from targeted improvements than broad system-wide branding campaigns.
Cost control also argues for better data integration. Bike-share trip records, weather observations, and air quality readings can be compared at daily or hourly scales, but the analysis must be transparent. If a city claims an intervention improved ridership during heat or smoke, it should show the baseline period, the comparison period, weather conditions, station selection, and any unrelated changes that could distort the result.
Air Quality Communication Without Overclaiming
Health Signals Need Clear Boundaries
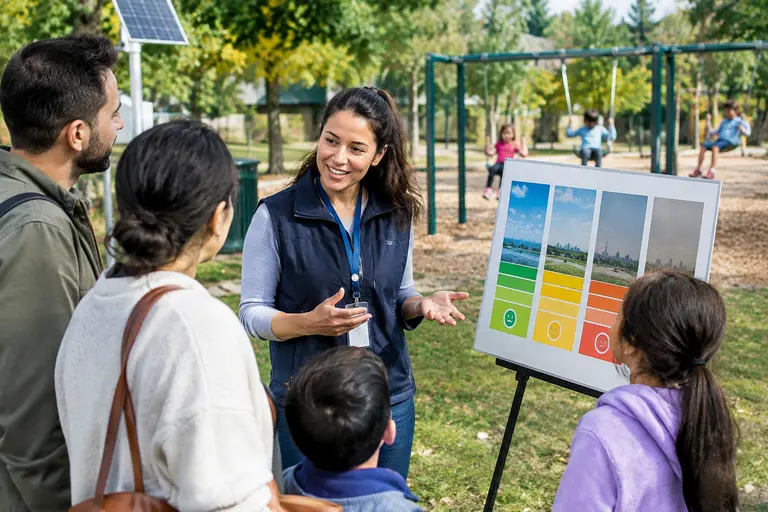
Transportation agencies can communicate observed ridership changes during poor air quality, but they should avoid giving medical advice. The research supports the claim that acute smoke events are associated with reduced bike-share use. It does not establish a personal threshold for every rider. Public agencies should direct health questions to appropriate public health sources and keep mobility messages focused on service availability, safer travel options, and measured conditions. For eye-specific health information, network resources such as the Wills Glaucoma website provide insights outside of transport analysis, illustrating the importance of relying on specialized health advice.
Air quality data can also be hard to interpret at the neighborhood scale. A citywide PM₂.₅ value may not capture corridor-level exposure, and smoke can shift rapidly. That uncertainty should be reflected in operator dashboards and public communications. A cautious message is better than a confident but unsupported claim.
Routine Pollution Findings Need Careful Interpretation
The weaker effect of routine pollutants should not be used to dismiss air quality concerns. Ozone or other pollutants may coincide with warm, sunny conditions that encourage riding, creating mixed statistical associations. The five-city evidence indicates that temperature and precipitation often dominate day-to-day ridership decisions. It does not prove that ordinary pollution has no health or mobility effect.
Bike-Sharing Ridership Planning Implications
Evidence Points To Resilient Street Operations
For Bike-Sharing Ridership, the main policy lesson is that weather resilience and air quality response should be treated as core parts of green transportation planning. Bike-share is not isolated from the rest of city operations. Waste collection schedules, curb access, street cleaning, bus reliability, and bike-lane maintenance all affect whether a rider experiences a corridor as usable. As an advocate for waste management innovation, I see a direct link: cleaner, better-coordinated streets support safer low-emission travel, while disorganized curb activity can weaken the same systems cities are trying to promote.
The evidence also points to a balanced climate interpretation. The 2026 five-city study anticipated that future warming may reduce the number of days with excessively cold weather in seasonally cold U.S. cities, which could increase annual cycling suitability. That finding should be held alongside the documented sensitivity to precipitation, heat stress concerns, and wildfire smoke. Warmer conditions may create more rideable days in some places, but acute smoke and extreme weather can still suppress use sharply.
A practical next step is not to assume that bike-share will either fail or flourish under changing conditions. The better approach is to measure how riders respond, protect the most exposed corridors, and report results with limits clearly stated. Bike-share systems can contribute to greener transportation, but their reliability depends on evidence-based planning at the street level.